



Eosinophilia and RA-ILD Save

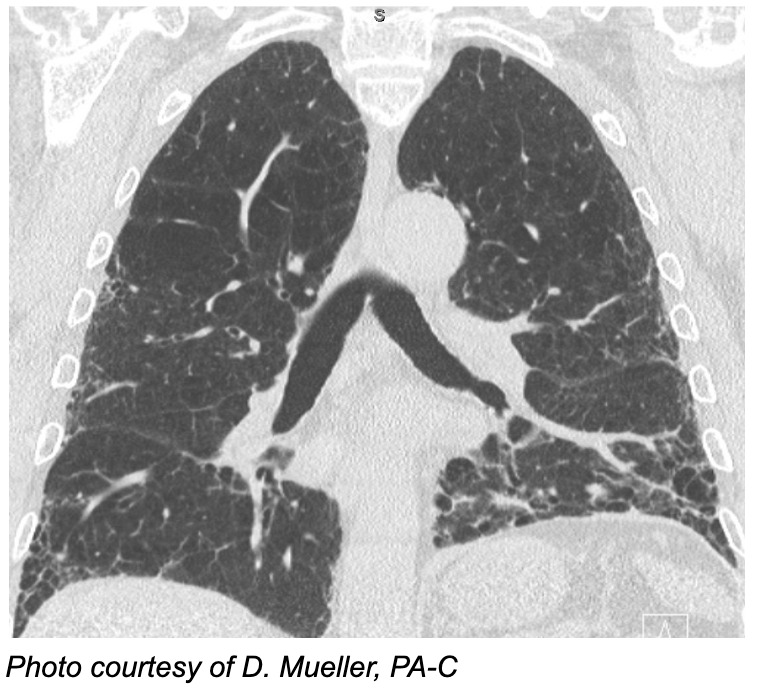
Most of us know the big, bad "S"s of risk for rheumatoid arthritis-associated interstitial lung disease (RA-ILD): sex (male), seropositivity, smoking and senescence. Other markers of RA-ILD risk exist, such as the MUC5B promoter variant and the serum biomarker Krebs von den Lungen-6 (KL-6), but they are not widely available in routine practice.
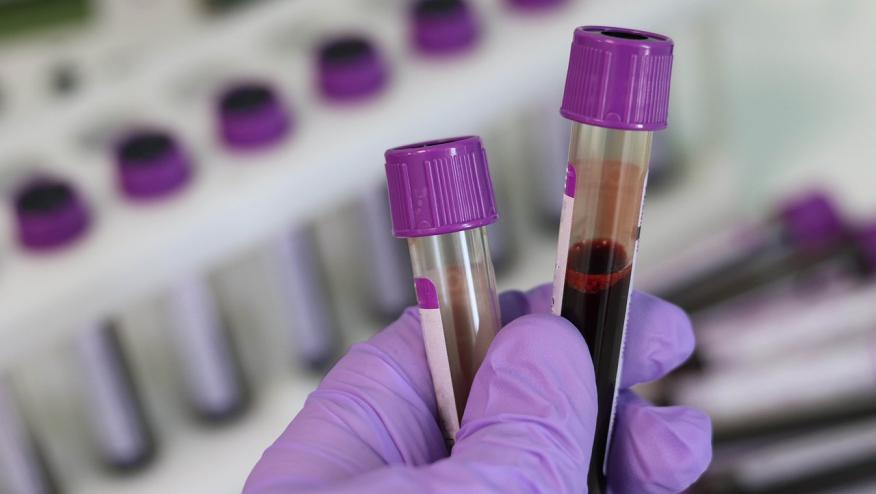
The absolute eosinophil count (AEC) on a routine complete blood count could be a useful addition when deciding which patients to work up for RA-ILD.
Abstract 1453 by Jones et al., is a cross-sectional analysis of the VA Rheumatoid Arthritis (VARA) registry. It examined whether peripheral blood AEC is associated with prevalent RA-ILD. The analysis included 2,519 patients with RA. Of these, 118 (4.7%) had RA-ILD, confirmed by medical record review and chest CT. The authors excluded patients with indeterminate ILD and those who developed ILD after enrollment. AEC values from the 365 days before enrollment were analyzed using three definitions: maximum (the primary measure), mean, and the value closest to enrollment. AEC was modeled two ways: as a continuous variable (per 1 SD increase) and in categories (<150, 150–299, 300–499 and >500 cells/µL).
Under all three definitions, a higher AEC was independently associated with prevalent RA-ILD. Per 1 SD increase, the adjusted odds ratios were 1.22 to 1.27. The results also showed a dose–response gradient. Compared with an AEC <150 cells/µL, an AEC >500 cells/µL carried roughly two- to three-fold greater odds of RA-ILD (aOR 2.21–3.10, depending on the definition).
In secondary analyses by radiographic pattern, each 1 SD increase in maximum AEC was associated with UIP-pattern ILD (aOR 1.28, 95% CI 1.06–1.54). The association with non-UIP ILD did not reach significance (aOR 1.17, 95% CI 0.92–1.49). However, the confidence intervals overlap substantially, and the non-UIP analysis was underpowered. These data therefore do not show a true difference between ILD patterns.
AEC is a cheap, readily available measure that needs no calculator. However, several limitations apply here. Because the ILD was already present, the study cannot show whether eosinophilia came before ILD or resulted from it or its treatment. Thus, AEC is an association, not a predictor. The analysis did not account for common causes of eosinophilia including airway disease, atopy, DMARDs known to cause hypersensitivity reactions and parasitic infections. Concern for an under-ascertainment of ILD also looms here; RA-ILD prevalence of 4.7% is lower than one would expect in an older, predominantly male VA population with heavy smoking exposure. Because HRCT was not performed systematically here, subclinical ILD was likely not accounted for. This would most likely bias results toward the null. Lastly, without AUC, sensitivity or specificity, AEC cannot yet be used as a screening or true risk-stratification tool.
Take Home Points
- In a large VA cohort, a higher peripheral AEC, particularly >500 cells/µL, was independently associated with prevalent RA-ILD. The cross-sectional design means it is an association, not a predictor.
- The signal appeared strongest for UIP, but the study wasn't powered to show a difference between ILD patterns.
- A raised AEC still calls for the standard workup (drugs, bugs, atopy and pulmonary comorbidity) before attributing it to ILD.
- Current guidelines (ACR/CHEST 2023, ERS/EULAR) support HRCT screening in higher-risk patients but don't truly define who is at “high risk”. AEC is a possible marker for that gap.
More ACR Coverage:
Related Content
In the management of RA-ILD, we are in a curious situation where we have become polarised in two different directions: aggressive treatment of all patients with combination therapies of biologic agents and anti-fibrotic drugs, or a “wait and see” approach. It is in this setting that the results of Abstract 0448 piqued my interest.
Dr. Janet Pope reports on poster abstracts 0019, 0037 and 0025 presented at ACR Convergence 26.
RheumNow expert faculty highlights key abstracts, emerging research, and clinical insights from the day's sessions, offering perspective on what these findings may mean for rheumatology practice. Faculty: Drs. Mike Putman, Janet Pope, Akhil Sood, David Liew, and Daric Mueller, PA-C.


If you are a health practitioner, you may Login/Register to comment.
Due to the nature of these comment forums, only health practitioners are allowed to comment at this time.